
Online crime maps for all streets in England and Wales
![]()
Ministers say interactive crime maps have published without compromising the privacy of victims and witnesses
Alan Travis, home affairs editor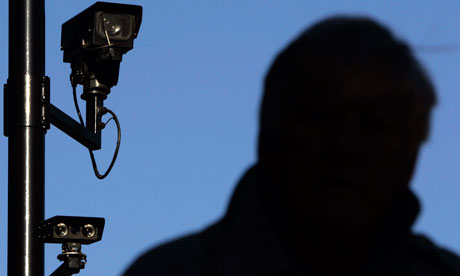
Interactive crime maps have been launched today for each street in England and Wales. Photograph: Luke MacGregor/Reuters
Detailed maps providing a monthly snapshot of crime and antisocial behaviour on every street across England and Wales are published for the first time today.
Home Office ministers say it is unprecedented for such interactive crime maps to be published for an entire country and that it has been done without compromising the privacy of victims and witnesses, or having a negative effect on house prices.
The maps, which are accessible by typing a postcode into the www.police.uk website, also provide contact details for neighbourhood policing teams, information about forthcoming beat meetings, CCTV footage of local incidents, and in some cases even a Twitter feed from beat officers.
Quarterly crime statistics have been available online at ward or local police division level for some time, but the £300,000 project launched today gives information about different types of crime and, for the first time, incidents of antisocial behaviour down to street leveThe maps give street-by-street results for six types of offence, including burglary, robbery, vehicle crime, violence, and antisocial behaviour. Sexual offences are included in “other crime” to avoid revealing the location of victims.
Six “trailblazing” forces are to go further in developing crime maps.
The home secretary’s own Thames Valley police are to map trends in late-night antisocial behaviour; Hampshire are to provide daily access to crime data; Lincolnshire and West Yorkshire are to explore providing information about convicted offenders alongside details of crimes; Surrey are to pioneer mobile phone use of the maps; and Leicestershire are developing an online case tracking system for victims.
The data can be broken down by neighbourhood or narrowed down to individual street level, revealing the shifting patterns of local crime hotspots over time.
Glover’s Court in Preston emerges as one of the streets with most recorded crime – 152 incidents in December, 44 of which involved violent offences.
The unusual pattern of 148 asbo incidents in Bolnore Road, Haywards Heath, is thought to relate to the way hoax calls are recorded centrally at the local police station by Sussex police force.
The information commissioner, Christopher Graham, who was consulted by the police over the exercise, said last night that blocks and zones were the most privacy-friendly way of crime-mapping, and that a strong public interest case would have to be made for the use of more intrusive indicators.
“I welcome the drive to improve accountability through greater transparency. Crime-mapping can be an effective means of letting people know what crimes are taking place in their local area, although care needs to be taken as this can potentially have an impact on the privacy of individuals such as victims or witnesses,” he said.
Nick Herbert, minister for policing and criminal justice, said the introduction of crime-mapping on this scale was the second major element in the coalition’s police reform plans to improve accountability, alongside the introduction of elected police and crime commissioners.
“We are giving people the information and power to hold their local forces to account and ensure that crime in their neighbourhood is driven down,” Herbert said. “I have been an advocate of street-level crime-mapping since seeing it work in Los Angeles, so I am excited to see this website launched today, particularly as I believe it goes further and is more comprehensive than any other scheme.”
Research published today by the National Policing Improvement Agency, based on a trial involving 7,434 members of the public, shows that such web-based crime maps do not fuel fear of crime.
Herbert challenged the idea that publishing such data could hit house prices – a concern voiced by estate agents in the past.
“That can’t be a reason not to tell the public what is happening,” he said. “Crime cannot be swept under the carpet.”
Insurance companies, however, may come to rely on them in setting premiums.
New guidelines from the information commissioner’s office (ICO) say that those who publish crime maps need to have procedures in place to deal with concerns from victims of crime that their identity has been revealed, or householders who believe their property has been incorrectly labelled as a crime hotspot. The ICO says the most invasive practice would be to pinpoint a particular household as being linked to a particular crime. He warns against pinpointing an address as being indicative that a crime took place in a general area.
Stark statistics
The crime map for London N1, which includes the Guardian’s King’s Cross offices, shows a total of 1,792 crimes and incidents of antisocial behaviour in December, making it a high-crime neighbourhood.
The figures include 681 incidents of antisocial behaviour, 240 violent crimes, 103 burglaries and 63 robberies. It gives contact details for the local safer neighbourhood team led by Sergeant Dave Hamill and offers CCTV footage from the Met currently available on YouTube of recent crimes, including footage of a man rape investigators want to talk to.
Related Articles

Britain and Chile 40 Years After Pinochet’s Coup
![]()
The ‘Other Special Relationship’ England Ask anybody from Santiago about the noise heard in the Chilean capital’s skies on the
Brasil movilizado: Pase libre a la participación política
![]()
“La revolución nace dentro de ti mismo”, dice –traducción mediante, una de las pancartas que llevan los jóvenes en las
Talks to begin on formation of new NI administration
![]()
Talks are set to begin on the formation of a new Northern Ireland Assembly following an election that saw gains
