
World population by country: UN guesses the shape of the world by 2100
![]()
What is the world’s population according to the latest UN estimates? See when it will hit 10 billion – and which countries are growing fastest
Original report here

A baby Photograph: Hans Strand/Getty
By the end of this year the world’s seven billionth citizen will be born. The latest United Nations population estimates, out this week, say the global population will reach 10bn in the next 90 years.
According to the UN Population Division’s best-case ‘medium’ estimate – and you can see the original report here – it will take 13 years to add the eighth billion, 18 years to add the ninth billion and 40 years to reach the tenth billion. Roll over the chart to see the data.
The big increases are coming from countries with high fertility rates – the high-fertility countries identified by the UN comprise of 39 countries in Africa, nine in Asia, six in Oceania and four in Latin America. 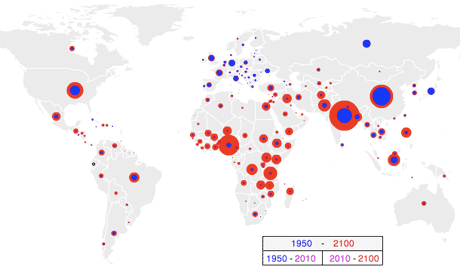
UN population interactive graphic
Today, 42% of the world’s population lives in low-fertility countries, defined in the UN report as
countries where women are not having enough children to ensure that, on average, each woman is replaced by a daughter who survives to the age of procreation
Low-fertility countries include all countries in Europe except Iceland and Ireland. Europe is the one region in the world to see its population decline by 2100 – and you can see below how fertility rates go down across the globe by 2100:
Roll over the chart to see the data. Get a fullscreen version
That trend is not repeated in the UK – our population has grown by 23% since 1950, and will grow another 21% by the year 2100 to reach 75.7m.
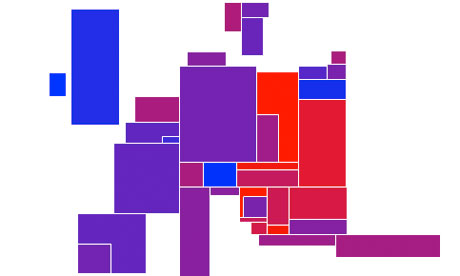 Europe population data: click image to see interactive
Population expert Hans Rosling points out the release is a treasure trove of new data, including detailed fertility rates by country, life expectancy and migration figures.
The high-fertility countries (> 3 kids per women) are mainly in Africa and only have 18% of the world population = 1.2 billion people. They are expected to tripple their population to 3,6 billion this century! The Low fertility countries are 40% of world population and will decrease their population and the intermediate are 40% will level of at 2050 … The peak size of the world population, therefore, depends on how fast peace, school, basic health care, poverty alleviation and family planning will become accessible to all in Africa and a few other countries like Yemen, Afghanistan and Pakistan
And what about China and India? China will hit its peak population in 2027 when it will have over 1.395bn people, before reducing down to 941m by the year 2100. India will hit 1.718bn in 2062, and will come down after that to 1.6bn by 2100.
The full data is below for you to play with – and we’ve added country codes too. What can you do with it?
Data summary
World population by country
All figures in 000s. Click heading to sort table. Download this data
Country 1950 2011 2100 % change, 1950- 2011 % change 2011- 2100 % change, 1950- 2100
SOURCE: UN POPULATION
Total population (1 July annually interpolated) in thousands – Medium variant Revision 2010 – WUP Revision 2011
Source: United Nations, Department of Economic and Social Affairs, Population Division: World Population Prospects DEMOBASE extract. 2011
Africa 229,895 1,045,923 3,574,141 354.96 241.72 1,454.68 Asia 1,403,389 4,207,448 4,596,224 199.81 9.24 227.51 Europe 547,287 739,299 674,796 35.08 -8.72 23.30 Latin America and the Caribbean 167,368 596,629 687,517 256.48 15.23 310.78 Northern America 171,615 347,563 526,428 102.53 51.46 206.75 Oceania 12,675 37,175 65,819 193.28 77.05 419.27 World 2,532,229 6,974,036 10,124,926 175.41 45.18 299.84 Afghanistan 8,151 32,358 110,879 296.96 242.66 1,260.23 Albania 1,215 3,216 1,863 164.69 -42.06 53.36 Algeria 8,753 35,980 39,983 311.06 11.13 356.80 American Samoa 19 70 158 267.23 126.99 733.57 Andorra 6 86 162 1,290.43 88.05 2,514.77 Angola 4,148 19,618 56,052 373.02 185.71 1,251.46 Anguilla 5 16 16 205.51 -0.74 203.24 Antigua and Barbuda 46 90 108 93.54 20.51 133.23 Argentina 17,150 40,765 49,201 137.69 20.70 186.88 Armenia 1,354 3,100 2,335 129.05 -24.70 72.48 Aruba 38 108 88 184.09 -18.44 131.69 Australia 8,177 22,606 35,908 176.44 58.85 339.12 Austria 6,936 8,413 7,805 21.29 -7.23 12.53 Azerbaijan 2,896 9,306 11,976 221.34 28.70 313.55 Bahamas 79 347 449 338.97 29.43 468.16 Bahrain 116 1,324 1,580 1,044.81 19.40 1,266.85 Bangladesh 37,895 150,494 157,134 297.14 4.41 314.66 Barbados 211 274 223 29.83 -18.46 5.86 Belarus 7,745 9,559 6,760 23.43 -29.28 -12.71 Belgium 8,628 10,754 12,588 24.63 17.05 45.88 Belize 69 318 555 361.31 74.46 704.82 Benin 2,255 9,100 36,752 303.50 303.87 1,529.62 Bermuda 37 65 65 74.66 0.53 75.58 Bhutan 168 738 782 338.46 5.92 364.40 Bolivia 2,714 10,088 20,021 271.76 98.46 637.79 Bosnia and Herzegovina 2,661 3,752 1,877 40.99 -49.97 -29.47 Botswana 413 2,031 2,476 392.26 21.93 500.19 Brazil 53,975 196,655 177,349 264.35 -9.82 228.58 British Virgin Islands 7 23 27 215.52 14.00 259.68 Brunei 48 406 667 745.69 64.39 1,290.23 Bulgaria 7,251 7,446 4,131 2.69 -44.53 -43.03 Burkina Faso 4,284 16,968 96,367 296.03 467.94 2,149.22 Burundi 2,456 8,575 14,587 249.11 70.10 493.84 Cambodia 4,346 14,305 16,661 229.17 16.47 283.38 Cameroon 4,466 20,030 53,693 348.46 168.06 1,102.12 Canada 13,737 34,350 48,290 150.05 40.58 251.53 Cape Verde 178 501 520 181.13 3.82 191.88 Cayman Islands 6 57 59 784.59 4.53 824.62 Central African Republic 1,327 4,487 10,954 238.21 144.13 725.68 Chad 2,429 11,525 43,648 374.41 278.71 1,696.62 Channel Islands 102 154 156 50.51 1.53 52.81 Chile 6,082 17,270 17,185 183.95 -0.49 182.55 China 550,771 1,347,565 941,042 144.67 -30.17 70.86 Colombia 12,000 46,927 58,137 291.07 23.89 384.49 Comoros 156 754 3,047 382.26 304.13 1,848.97 Congo 808 4,140 14,224 412.52 243.60 1,661.03 Congo, Dem Rep 12,184 67,758 212,113 456.13 213.05 1,640.96 Cook Islands 15 20 21 35.38 4.53 41.51 Costa Rica 966 4,727 5,019 389.29 6.19 419.58 Côte d’Ivoire 2,630 20,153 56,412 666.23 179.92 2,044.85 Croatia 3,850 4,396 3,317 14.16 -24.54 -13.85 Cuba 5,920 11,254 7,022 90.10 -37.60 18.62 Cyprus 494 1,117 1,192 126.02 6.76 141.30 Czech Republic 8,876 10,534 10,324 18.68 -1.99 16.32 Denmark 4,268 5,573 6,032 30.56 8.25 41.32 Djibouti 62 906 1,923 1,360.56 112.37 3,001.82 Dominica 51 68 53 32.43 -21.04 4.57 Dominican Republic 2,380 10,056 12,231 322.51 21.62 413.87 Ecuador 3,387 14,666 18,319 332.96 24.91 440.81 Egypt 21,514 82,537 123,227 283.64 49.30 472.78 El Salvador 2,200 6,227 6,783 183.08 8.92 208.33 Equatorial Guinea 226 720 2,054 219.33 185.22 810.82 Eritrea 1,141 5,415 15,496 374.48 186.15 1,257.73 Estonia 1,101 1,341 1,145 21.76 -14.61 3.97 Ethiopia 18,434 84,734 150,140 359.67 77.19 714.48 Faeroe Islands 32 49 55 55.10 12.98 75.23 Falkland Islands (Malvinas) 2 3 3 33.88 0.46 34.50 Fiji 289 868 1,005 200.49 15.71 247.71 Finland 4,009 5,385 5,842 34.32 8.48 45.71 France 41,832 63,126 80,288 50.90 27.19 91.93 French Guiana 25 237 721 830.49 204.02 2,728.89 French Polynesia 61 274 281 351.06 2.75 363.48 Gabon 469 1,534 3,776 227.13 146.11 705.10 Gambia 271 1,776 6,084 554.49 242.55 2,141.94 Georgia 3,527 4,329 2,367 22.74 -45.32 -32.89 Germany 68,376 82,163 70,392 20.16 -14.33 2.95 Ghana 4,981 24,966 67,230 401.23 169.29 1,249.77 Gibraltar 20 29 25 42.72 -13.58 23.34 Greece 7,566 11,390 11,108 50.54 -2.47 46.82 Greenland 23 57 41 149.13 -27.62 80.32 Grenada 77 105 75 36.80 -28.32 -1.95 Guadeloupe 210 463 424 120.51 -8.48 101.81 Guam 60 182 252 205.30 38.48 322.78 Guatemala 3,146 14,757 46,036 369.07 211.95 1,363.29 Guinea 3,094 10,222 36,664 230.41 258.68 1,085.13 Guinea-Bissau 518 1,547 5,518 198.56 256.70 964.97 Guyana 407 756 693 85.96 -8.28 70.57 Haiti 3,221 10,124 14,566 214.28 43.88 352.18 Honduras 1,487 7,755 13,789 421.42 77.81 827.14 Hong Kong 1,974 7,122 10,355 260.80 45.40 424.59 Hungary 9,338 9,966 8,672 6.73 -12.98 -7.12 Iceland 143 324 480 126.83 48.01 235.74 India 371,856 1,241,492 1,550,899 233.86 24.92 317.07 Indonesia 74,837 242,326 254,178 223.80 4.89 239.64 Iran 17,414 74,799 62,059 329.53 -17.03 256.37 Iraq 5,719 32,665 145,276 471.15 344.74 2,440.14 Ireland 2,913 4,526 7,046 55.36 55.68 141.87 Isle of Man 55 83 81 50.81 -2.36 47.25 Israel 1,258 7,562 15,312 501.14 102.48 1,117.19 Italy 46,367 60,789 55,619 31.10 -8.50 19.95 Jamaica 1,403 2,751 2,166 96.11 -21.28 54.38 Japan 82,199 126,497 91,330 53.89 -27.80 11.11 Jordan 449 6,330 9,495 1,310.27 49.99 2,015.28 Kazakhstan 6,703 16,207 24,876 141.78 53.49 271.12 Kenya 6,077 41,610 160,009 584.74 284.55 2,533.13 Kiribati 26 101 164 287.33 62.60 529.79 Korea, North 9,737 24,451 24,552 151.12 0.41 152.16 Korea, South 19,211 48,391 37,221 151.89 -23.08 93.75 Kuwait 152 2,818 6,371 1,750.92 126.07 4,084.29 Kyrgyzstan 1,740 5,393 9,258 209.92 71.67 432.04 Laos 1,683 6,288 6,956 273.64 10.62 313.31 Latvia 1,949 2,243 1,650 15.09 -26.46 -15.36 Lebanon 1,443 4,259 3,612 195.21 -15.20 150.35 Lesotho 734 2,194 2,874 198.91 31.02 291.64 Liberia 911 4,129 16,535 353.12 300.49 1,714.71 Libya 1,029 6,423 8,073 524.17 25.69 684.54 Liechtenstein 14 36 50 163.89 38.73 266.09 Lithuania 2,567 3,307 2,453 28.83 -25.85 -4.47 Luxembourg 296 516 740 74.30 43.38 149.91 Macao 196 556 810 182.84 45.83 312.47 Macedonia 1,230 2,064 1,391 67.84 -32.61 13.10 Madagascar 4,084 21,315 94,222 421.98 342.04 2,207.36 Malawi 2,881 15,381 129,502 433.93 741.97 4,395.50 Malaysia 6,110 28,859 46,946 372.33 62.67 668.36 Maldives 74 320 300 334.20 -6.42 306.34 Mali 4,638 15,840 80,506 241.54 408.26 1,635.93 Malta 312 418 394 33.93 -5.64 26.37 Marshall Islands 13 55 88 321.66 61.12 579.39 Martinique 222 407 301 83.39 -26.04 35.63 Mauritania 657 3,542 10,434 438.90 194.63 1,487.74 Mauritius 493 1,307 1,157 164.89 -11.47 134.51 Mayotte 15 211 688 1,290.61 226.77 4,444.13 Mexico 27,866 114,793 127,081 311.95 10.70 356.05 Micronesia 32 112 161 248.57 44.69 404.34 Moldova 2,341 3,545 1,958 51.43 -44.77 -16.38 Monaco 20 35 40 77.14 13.18 100.48 Mongolia 780 2,800 4,831 258.90 72.52 519.18 Montenegro 399 632 499 58.64 -21.05 25.26 Montserrat 14 6 7 -55.70 10.20 -51.18 Morocco 8,953 32,273 33,068 260.47 2.46 269.35 Mozambique 6,442 23,930 77,347 271.46 223.23 1,100.65 Myanmar 17,158 48,337 46,941 181.72 -2.89 173.59 Namibia 485 2,324 3,728 378.91 60.43 668.32 Nauru 3 10 10 249.07 -1.97 242.19 Nepal 8,231 30,486 44,987 270.38 47.57 446.55 Netherlands 10,027 16,665 17,381 66.20 4.30 73.34 Netherlands Antilles 112 203 147 81.60 -27.55 31.56 New Caledonia 65 255 334 293.09 30.96 414.79 New Zealand 1,908 4,415 6,323 131.37 43.24 231.42 Nicaragua 1,295 5,870 7,261 353.27 23.70 460.69 Niger 2,462 16,069 139,209 552.75 766.32 5,554.94 Nigeria 37,860 162,471 729,885 329.14 349.24 1,827.87 Niue 5 1 1 -69.45 -26.44 -77.52 Northern Mariana Islands 7 61 50 774.04 -18.24 614.57 Norway 3,265 4,925 6,964 50.84 41.41 113.30 Oman 456 2,846 2,839 523.58 -0.24 522.10 Pakistan 37,542 176,745 261,271 370.79 47.82 595.93 Palau 7 21 28 176.97 37.58 281.05 Palestinian Territory, Occupied 932 4,152 14,868 345.57 258.07 1,495.44 Panama 860 3,571 5,170 315.21 44.78 501.15 Papua New Guinea 1,708 7,014 18,113 310.60 158.24 960.34 Paraguay 1,473 6,568 11,364 345.84 73.01 671.36 Peru 7,632 29,400 35,911 285.19 22.15 370.50 Philippines 18,397 94,852 177,803 415.60 87.45 866.51 Poland 24,824 38,299 29,454 54.28 -23.10 18.65 Portugal 8,417 10,690 6,754 27.00 -36.82 -19.76 Puerto Rico 2,218 3,746 3,024 68.87 -19.26 36.35 Qatar 25 1,870 2,162 7,380.76 15.63 8,549.98 Réunion 248 856 1,086 244.95 26.88 337.67 Romania 16,311 21,436 14,839 31.42 -30.78 -9.02 Russia 102,702 142,836 111,057 39.08 -22.25 8.14 Rwanda 2,072 10,943 42,316 428.08 286.70 1,942.11 Saint Helena 5 4 3 -18.44 -13.98 -29.85 Saint Kitts and Nevis 46 53 64 15.19 20.54 38.85 Saint Lucia 83 176 169 112.66 -4.24 103.64 Saint Pierre and Miquelon 5 6 6 32.10 1.01 33.44 Saint Vincent and the Grenadines 67 109 96 63.23 -12.51 42.80 Samoa 82 184 313 123.96 70.20 281.18 San Marino 13 32 32 148.30 1.41 151.80 Sao Tome and Principe 60 169 356 180.88 111.35 493.64 Saudi Arabia 3,121 28,083 42,427 799.70 51.08 1,259.27 Senegal 2,416 12,768 44,075 428.40 245.21 1,724.08 Serbia 6,732 9,854 6,956 46.37 -29.41 3.32 Seychelles 36 87 73 139.19 -16.06 100.77 Sierra Leone 1,895 5,997 14,154 216.42 136.00 646.74 Singapore 1,022 5,188 5,659 407.58 9.09 453.70 Slovakia 3,437 5,472 4,516 59.21 -17.46 31.42 Slovenia 1,473 2,035 1,846 38.15 -9.27 25.34 Solomon Islands 90 552 1,630 515.04 195.12 1,715.14 Somalia 2,264 9,557 72,976 322.11 663.60 3,123.23 South Africa 13,683 50,460 54,477 268.77 7.96 298.13 Spain 28,070 46,455 45,011 65.50 -3.11 60.35 Sri Lanka 8,241 21,045 19,888 155.39 -5.50 141.35 Sudan 9,190 44,632 127,621 385.66 185.94 1,288.70 Suriname 215 529 551 146.24 4.15 156.45 Swaziland 273 1,203 1,813 340.78 50.65 564.03 Sweden 7,014 9,441 11,859 34.60 25.62 69.08 Switzerland 4,668 7,702 7,252 64.99 -5.84 55.35 Syria 3,413 20,766 32,623 508.38 57.10 855.77 Tajikistan 1,532 6,977 11,687 355.56 67.51 663.12 Tanzania 7,650 46,218 316,338 504.18 584.44 4,035.26 Thailand 20,607 69,519 58,166 237.35 -16.33 182.26 Timor-Leste 433 1,154 4,742 166.23 310.99 994.16 Togo 1,395 6,155 13,558 341.06 120.29 871.61 Tokelau 2 1 2 -27.77 72.66 24.71 Tonga 47 105 193 121.32 84.91 309.26 Trinidad and Tobago 636 1,346 1,031 111.69 -23.40 62.16 Tunisia 3,530 10,594 10,891 200.15 2.81 208.57 Turkey 21,238 73,640 79,200 246.73 7.55 272.91 Turkmenistan 1,211 5,105 5,708 321.58 11.80 371.32 Turks and Caicos Islands 5 39 38 676.38 -1.86 661.94 Tuvalu 5 10 20 90.61 104.61 290.01 Uganda 5,158 34,509 171,190 569.02 396.07 3,218.79 Ukraine 37,298 45,190 30,254 21.16 -33.05 -18.89 United Arab Emirates 70 7,891 10,357 11,239.33 31.25 14,783.37 United Kingdom 50,616 62,417 75,676 23.32 21.24 49.51 United States 157,813 313,085 478,026 98.39 52.68 202.91 United States Virgin Islands 27 109 80 306.22 -26.59 198.22 Uruguay 2,239 3,380 3,396 50.99 0.48 51.72 Uzbekistan 6,314 27,760 29,254 339.66 5.38 363.32 Vanuatu 48 246 751 414.98 205.65 1,474.03 Vatican City 1 0 0 -49.28 5.45 -46.52 Venezuela 5,094 29,437 40,507 477.91 37.61 695.24 Vietnam 28,264 88,792 82,604 214.15 -6.97 192.25 Wallis and Futuna Islands 7 13 11 92.09 -19.63 54.38 Western Sahara 14 548 848 3,883.56 54.68 6,061.88 Yemen 4,316 24,800 99,032 474.60 299.33 2,194.54 Zambia 2,340 13,475 140,348 475.77 941.55 5,896.89 Zimbabwe 2,747 12,754 21,838 364.33 71.22 695.03
Related Articles

Las limitaciones de Nelson Mandela
![]()
Este artículo señala que la estrategia antirracista de Nelson Mandela era necesaria pero insuficiente para mejorar el bienestar y calidad
Democracy Virus Has Dictators Fretting
![]()
Fear of FreedomBy Erich Follath Photo REUTERS First it was Ben Ali in Tunisia, then Mubarak in Egypt. Now Libya’s
HUELGA GENERAL EN CONTRA DE LA REFORMA DE LAS PENSIONES
![]()
La mayoría social planta cara al recorte de las pensiones La mayoría sindical vasca calificó la huelga general como un
